All Posts

All Posts

 #Results

Technology Basics Are Not Yet Consistently a Foregone Conclusion

While the assessment continues to observe substantial variances across participating organisations when it comes to the availability of existing digital solutions to their staff, there also remains a substantial difference between what staff from across all areas  of healthcare and social care have reported via our staff survey, and the responses given on behalf of […]

A pie chart showing reasons for the underutilisation of digital solutions
20/02/2025
Rebecca Hawkins

 #Results

National Solutions Are Not Yet Fully Adopted

 With the exception of a steady migration away from homegrown solutions, the 2024 update to the Digital Maturity Assessment has seen little change to the mix of solution architectures in operation by participating organisations.  In terms of imminent go-live plans, the 2024 update shows less focus on records-related and ePrescribing systems in alignment with our […]

This image shows a multicoloured bar chart. The chart shows the types of systems in use for different purposes. Types of systems are national and local.
20/02/2025
Rebecca Hawkins

 #Results

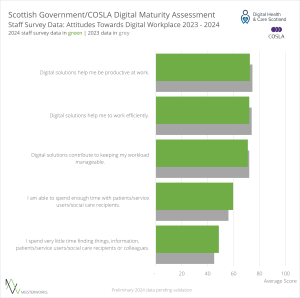
Workforce Accepting Digital Transformation, but Lacking Skills and Tools

 Across Scotland, workforce attitude towards digital ways of working remains cautiously positive; on average, most staff survey participants felt that digital solutions contributed to their effectiveness and efficiency, and helped keep their workload manageable.  Although there has been some progress around topics like Information Governance, Systems and Clinical Safety, skills development programmes enabling digital ways […]

A bar chart representing responses to the staff survey questions on benefit tracking.
20/02/2025
Rebecca Hawkins

 #Results

Most Digital Management Groups are Aware of Needing to Operate Sustainably

On average, participating organisations have made satisfactory progress in terms of managing their environmental impact using digital tools and especially in support of optimising their consumption of energy and supplies.   Optimising staff and service user travel digitally has also improved, along with capabilities to support their sustainable transport choices.  The least mature indicators for the […]

A bar chart showing aggregated responses to questions about how organisations manage the environmental impact of digital operations and how they use digital so
20/02/2025
Rebecca Hawkins

 #Results

Rich Intelligence Capabilities Can Support Digital Management

Data from the 2024 update to the SG/COSLA Digital Maturity Assessment supports our initial view that the availability of high-quality business and clinical intelligence capabilities in turn promotes digitally enabled leadership.  Organisations showing score improvements for indicators including active monitoring of data quality for digital data used for BI and CI purposes, active management of […]

This image shows a scatter chart. The chart depicts organisations’ scores in management categories on the y-axis and business intelligence categories on the x-axis.
20/02/2025
Rebecca Hawkins

 #Results

Inclusive Digital Operating Models Are Winning

 Data from the 2024 update to the assessment confirms our observations on the effectiveness of digitally enabled leadership included in our 2023 report: Organisations with a high degree of digital maturity within management categories such as Strategic Alignment, Leadership, Resourcing, Governance and Information Governance are most likely to also score relatively highly for operational categories […]

This image shows a scatter chart. The chart depicts organisations’ scores in management categories on the y-axis and operational categories on the x-axis.
20/02/2025
Rebecca Hawkins

 #Results

Digital Maturity Varies Significantly Across the Scottish Healthcare and Social Care Landscape

As reported at the beginning of this section of the report, the variances between different organisations within the Scottish health and social care landscape is increasing. Analysis by assessment section illuminates further that this development is not limited to specific areas of digital maturity, but rathe that it affects practically all sections, and that it […]

A table illustrating that scores for participating organisations have varied substantially
20/02/2025
Rebecca Hawkins

 #Results

Integrated Care Systems Remain Digitally Disintegrated

Most organisations scored reasonably high in the Readiness sections; the assessment confirms that Leadership, Strategy and Governance consistently include local health and social care systems in terms of planning, digital transformation, benefits realisation and operations However, capability scores demonstrating digital integration sit at a lower level than suggested by those results. Basic manifestations of integrated […]

Line chart illustrating that there is a significant difference between the best and worst performing organisations within individual care systems
20/02/2025
Rebecca Hawkins

 #Results

Digital Maturity in the Real World

To provide insights into how health and care professionals and other members of the workforce perceive the status quo when it comes to digital maturity, this report draws on our series of topic-specific briefings published on the Festival of Transformation website throughout 2024/2025.  Based on analysis of verbatim responses to the Assessment’s staff survey, key […]

A bar chart comparing views of users of digital solutions with those of non-users
20/02/2025
Rebecca Hawkins

 #Video

Assessment Results: 2024 Update – Session 1/2: Readiness

Insights on Developments in Digital Maturity Leadership, Strategy and Governance A recording of the recent event on the 2024 assessment results. This event took place on 6th February 2025. Henrik Moeller presented an analysis of results from the 2024 update to the SG / COSLA Digital Maturity Assessment: The presentation featured a brief slide deck […]

12/02/2025
Rebecca Hawkins